Lemur catta tutorial
Autor: Arman Pili con ediciones adicionales por Chihjen Ko
Este es un guion de ejemplo que se puede utilizar para desarrollar tus propios datos procesando flujos de trabajo. El guion te lleva a través el proceso de descarga, visualizando y limpiando los datos mediados por GBIF. Recuerde que el guion es solo una herramienta y que, en definitiva, es usted el usuario que asegura que los datos sean aptos para un propósito.
Usted puede descargar el documento R Markdown para su propio uso aquí - Lemur catta project. Usted será redirigido a una otra página. Pulsa con el botón derecho y "Guarda como…" para guardar el archivo en su disco duro. (Si lo guarda como un archivo Rmd en lugar que un archivo .txt se beneficiará de la funcionalidad adicional que viene con ese formato cuando se abre en RStudio).
| A medida que nuevos datos se añaden al índice de GBIF, los resultados, recuentos e imágenes mostradas abajo podrían diferir de las suyas. |
Paquetes
Se necesitarán de los siguientes paquetes:
                            #notes
library(rgbif)              #for downloading datasets from gbif
library(countrycode)        #for getting country names based on countryCode important
library(sf)                 #for manipulating downloaded maps
library(terra)              #for spatial data analysis
library(rnaturalearth)      #for downloading maps
library(rnaturalearthdata)  #vector data of maps
library(tidyverse)          #for tidy analysis
library(CoordinateCleaner)  #for quality checking of occurrence data
The scenario
We are interested in a species of a country (Madagascar) and want to learn about its presence in the GBIF data space. We will first prepare maps for presentation. We will then download data and plot them on the maps. We will also try to adjust the data (cleaning) and see the difference plotted.
Through the process, you will learn the techniques for examining the downloaded data and ways to tweak them.
Downloading data from GBIF
Now we are going to download data of a species from GBIF. Here we want the data about the Ring-Tailed Lemur (Lemur catta). We need to first determine the ID of the species in the GBIF index, as names alone can sometimes be ambiguous.
Looking up species name usage to determine the taxonKey
The following line calls GBIF Species API and retrieve possible matches.
image::data-use::Taxon_key.png[align=center,width=900,height=125]

Looks like we have a good matched accepted name here. The `usageKey` is the key that identify the usage of a name in the https://www.gbif.org/dataset/d7dddbf4-2cf0-4f39-9b2a-bb099caae36c[GBIF Taxonomy Backbone]. Once we decide which 'usage' is what we are looking for, We will use the key as the `taxonKey` for specifying the taxon for its occurrence data.

The following code block store the usageKey of _Lemur catta_ in a variable `usageKey`.

```{r} usageKey <- 2436412 # Alternatively, since we know there is only one match, the following line will store the key in the variable, too. # usageKey <- name_backbone(name = "Lemur catta", rank = "species") %>% pull(usageKey) ```

=== Use the taxonKey to generate the occurrence download of the species of interest
The following code block sends a request for download to the GBIF Occurrence API. A successful request will return a download key and initiate the preparing of the requested data. Note that as we've stored the key in the `usageKey` variable, for the required `taxonKey` for occ_download(), we simply supply the variable. Also, we need to supply our GBIF.org login credentials to request a download.

```{r}
gd_key <- occ_download(
    pred("taxonKey", usageKey),
#   pred("hasCoordinate", TRUE),
    format = "SIMPLE_CSV",
    user = "USERNAME",
    pwd = "PASSWORD",
    email = "EMAIL_ADDRESS"
)
Note that, with "pred("hasCoordinate", TRUE),", we only want data with coordinates, which are required for our plotting. But you can test run the block with the line commented and see some errors would appear in later steps.
Once the download request is accepted, GBIF API will return a message with a download ID, which is then stored in gd_key.
Actually downloading the file
The download may take some time to prepare depending on the size. So it’s always good to fine tune the previous call to download only needed records. Once it’s ready, the download key can be used to retrieve the ZIP file and load the records, hence the following code block.
gd <- occ_download_get(gd_key, overwrite = TRUE) %>%
    occ_download_import()

head(gd, 10) # view first ten rows ```
image::data-use::download.png[align=center,width=900,height=250]

### Citing GBIF data Always cite the downloaded dataset in your report. The following code helps generate the citation.

```{r} print(gbif_citation(occ_download_meta(gbif_download_key))$download) ```

== Data Visualization
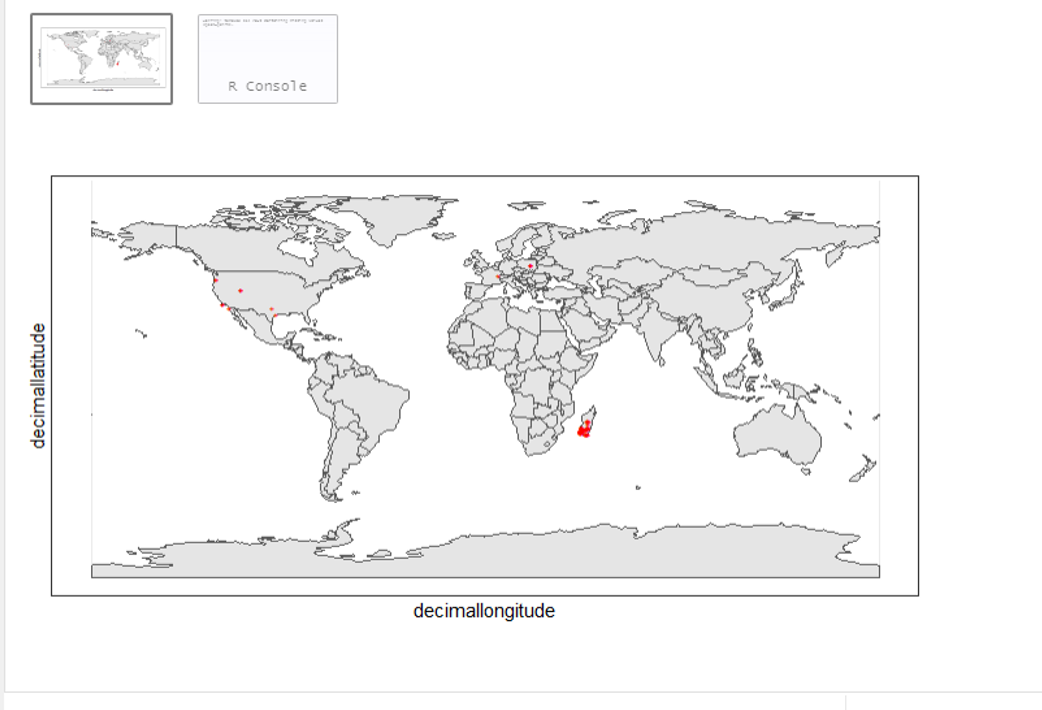
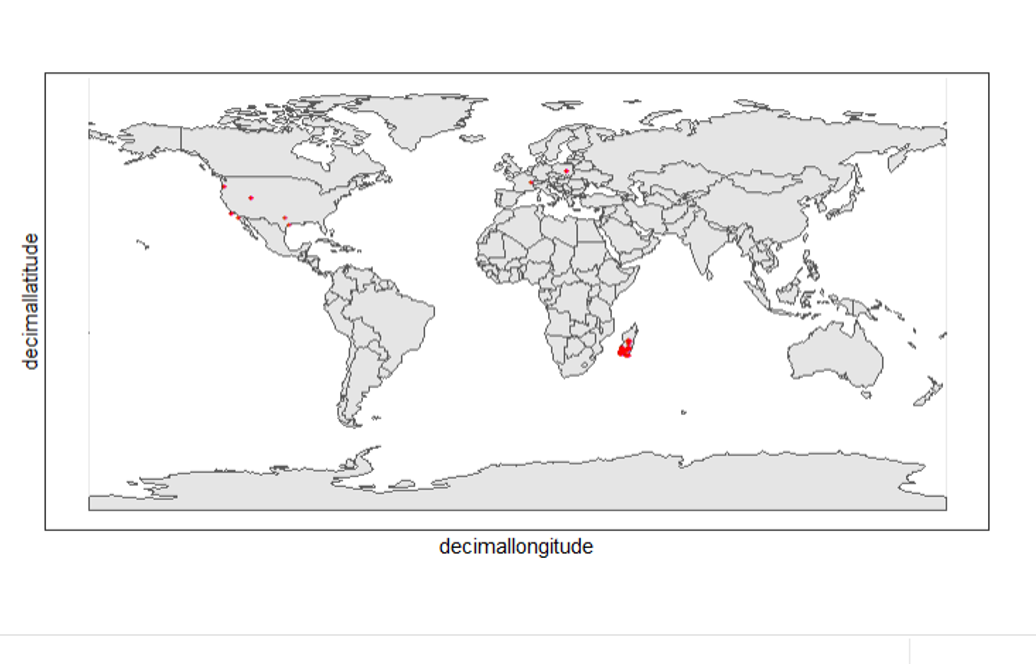
_Lemur catta_ is native to Madagascar; but just to make sure, let's verify the data by plotting occurrences on a map.

```{r, message = FALSE, error = FALSE}
ggplot() +
  geom_sf(data = world_map) +
  geom_point(data = gd,
             aes(x = decimalLongitude,
                 y = decimalLatitude),
             shape = "+",
             color = "red") +
  theme_bw()
From the first look, is there anything unusual with the distribution of the Lemur species?
Whoops! It seems like there are unusual occurrences outside its native range. There are red dots dropped in other countries. We need to look into the data.
Also, we have a warning saying that some hundred rows of records contain missing values and are removed from the map. We should remove those first.
The following code block filters away records without decimallatitude or decimallongitude, then store the result as a new data frame gdf.
```{r} table(gdf$countryCode) ```
image::data-use::countries.png[align=center,width=600,height=75]

It appears that many records have coordinates outside Madagascar. Let's also have a look at the nature of these records.

```{r} gdf %>% distinct(basisOfRecord) gdf %>% distinct(establishmentMeans) ``` There are 5 distinct values for https://dwc.tdwg.org/terms/#dwc:basisOfRecord[DwC:basisOfRecord]. We also looked at https://dwc.tdwg.org/list/#dwc_establishmentMeans[dwc:establishmentMeans], where only `NATIVE` is noted for some records.

== Data cleaning

After some exploring of our data, we know that there are potential quality issues in our download. Apparently points outside Madagascar are suspicious, and we have just looked at basisOfRecord and establishmentMeans columns for cues of needed data actions.

**La limpieza de datos** suele implicar procedimientos para eliminar registros no deseados en función de algún criterio, o para corregir valores con el fin de lograr una coherencia general operativa. En la siguiente sección trataremos de filtrar los datos, mostrar la diferencia y trazarla en el mapa.

== Paso 1: base de registro

Nos gustaría evaluar las observaciones y colecciones, por lo que `ESPÉCIMEN FÓSIL` y `MUESTRA DE MATERIAL` no es nuestra preocupación aquí, vamos a tratar de excluirlos de nuestra descarga.

```{r}
clean_step1 <- gdf %>%
  as_tibble() %>%
  filter(!basisOfRecord %in% c("FOSSIL_SPECIMEN", "MATERIAL_SAMPLE"))

print(paste0(nrow(gdf)-nrow(clean_step1), " records deleted; ",
             nrow(clean_step1), " records remaining."))
Trazar registros crudos contra registros pulidos
Se puede utilizar geom_point() varias veces para apilar marcadores de diferentes marcos de datos. Aquí se muestran los registros limpios en rojo, y los crudos en negro. Observe el marcador negro "+" en Denamarca.
ggplot() +
  geom_sf(data = world_map) +
  geom_point(data = gdf,
             aes(x = decimalLongitude,
                 y = decimalLatitude),
             shape = "+",
             color = "black") +
  geom_point(data = clean_step1,
             aes(x = decimalLongitude,
                 y = decimalLatitude),
             shape = "+",
             color = "red") +
  theme_bw()
Paso 2: Indicar las coordenadas problemáticas
Indicar registros con información problemática de incidencia usando las funciones del paquete https://ropensci.github.io/CoordinateCleaner/index.html[coordinateCleaner. Consulte los comentarios para saber qué hace cada función.
clean_step2 <- clean_step1 %>%
  filter(!is.na(decimalLatitude),
         !is.na(decimalLongitude),
         countryCode == "MG") %>% # "MG" is the ISO 3166-1 alpha-2 code for Madagascar
  cc_dupl() %>% # Identify duplicated records
  cc_zero() %>% # Identify zero coordinates
  cc_equ() %>% # Identify records with identical lat/lon
  cc_val() %>% # Identify invalid lat/lon coordinates
  cc_sea() %>% # Identify non-terrestrial coordinates
  cc_cap(buffer = 2000) %>% # Identify coordinates in vicinity of country capitals
  cc_cen(buffer = 2000) %>% # Identify coordinates in vicinity of country and province centroids
  cc_gbif(buffer = 2000) %>% # Identify records assigned to GBIF headquarters
  cc_inst(buffer = 2000) # Identify records in the vicinity of biodiversity institutions

print(paste0(nrow(gdf)-nrow(clean_step2), " records deleted; ",
             nrow(clean_step2), " records remaining."))
Trazar registros crudos contra registros limpios (paso 2)
ggplot() +
  geom_sf(data = world_map) +
  geom_point(data = gdf,
             aes(x = decimalLongitude,
                 y = decimalLatitude),
             shape = "+",
             color = "black") +
  geom_point(data = clean_step2,
             aes(x = decimalLongitude,
                 y = decimalLatitude),
             shape = "+",
             color = "red") +
  theme_bw()
Otra vez, los marcadores "" negros "" indican los registros de los conjuntos de datos crudos; mientras que los marcadores "+" rojos indican los registros de conjuntos de datos limpios.
Acercarse a Madagascar
Con cord_sf(), nos podemos acercar paras mostrar los marcadores en Madagascar.
ggplot() +
  geom_sf(data = country_map) +
  geom_point(data = gdf,
             aes(x = decimalLongitude,
                 y = decimalLatitude),
             shape = "+",
             color = "black") +
  geom_point(data = clean_step2,
             aes(x = decimalLongitude,
                 y = decimalLatitude),
             shape = "+",
             color = "red") +
  coord_sf(xlim = st_bbox(country_map)[c(1,3)],
           ylim = st_bbox(country_map)[c(2,4)]) +
  theme_bw()
Paso 3: Coordinar la calidad
Nos gustaría seguir eliminando registros con incertidumbre de las coordenadas y problemas de precisión. La incertidumbre de coordenadas en metros debería ser inferior a 10000, mientras que la precisión de coordenadas debería ser mejor que 0.01.
clean_step3 <- clean_step2 %>%
  filter(is.na(coordinateUncertaintyInMeters) |
           coordinateUncertaintyInMeters < 10000,
         is.na(coordinatePrecision) |
           coordinatePrecision > 0.01)

print(paste0(nrow(gdf)-nrow(clean_step3), " records deleted; ",
             nrow(clean_step3), " records remaining." ))
Quedan solo 14 registros, como se muestra en el siguiente gráfico.
Trazar registros nuevos versus registros limpios (paso 3)
ggplot() +
  geom_sf(data = country_map) +
  geom_point(data = gdf,
             aes(x = decimalLongitude,
                 y = decimalLatitude),
             shape = "+",
             color = "black") +
  geom_point(data = clean_step3,
             aes(x = decimalLongitude,
                 y = decimalLatitude),
             shape = "+",
             color = "red") +
  coord_sf(xlim = st_bbox(country_map)[c(1,3)],
           ylim = st_bbox(country_map)[c(2,4)]) +
  theme_bw()
Paso 4: Filtrado por rangos temporal
Podríamos tener otros niveles de datos para trabajar con la descarga de incidencia (por ejemplo https://worldclim.org/data/index.html[WorldClim proporciona datos desde 1960). Dependiendo de la disponibilidad temporal de los datos, por ejemplo, después de 1955, nosotros queremos también filtrar los registros de incidencia anterior al año, ya que no serían utilizados.
La función filtro() aplicada a los atributos temporales puede eliminar fácilmente los registros con un rango temporal fuera de nuestras variables predictivas.
clean_step4 <- clean_step3 %>%
  filter(year >= 1955)

print(paste0(nrow(gdf)-nrow(clean_step3), " records deleted; ",
             nrow(clean_step4), " records remaining." ))
Como resultado, tenemos solo tres registros después de aplicar este filtro. Consulte el gráfico siguiente.
ggplot() +
  geom_sf(data = country_map) +
  geom_point(data = gdf,
             aes(x = decimalLongitude,
                 y = decimalLatitude),
             shape = "+",
             color = "black") +
  geom_point(data = clean_step4,
             aes(x = decimalLongitude,
                 y = decimalLatitude),
             shape = "+",
             color = "red") +
  coord_sf(xlim = st_bbox(country_map)[c(1,3)],
           ylim = st_bbox(country_map)[c(2,4)]) +
  theme_bw()
Conclusión
Este documento se limita a mostrar lo que los usuarios de datos de GBIF pueden hacer tras descargar los datos del índice global. Antes de introducir los datos en un flujo de trabajo analítico, los usuarios suelen examinar la descarga observando los valores únicos y visualizando las facetas y, a continuación, deciden limpiar o filtrar los datos para que el análisis posterior pueda ejecutarse con los ajustes deseados. El proceso puede incluir muchas pruebas y ajustes, y aquí hemos presentado algunos de ellos.