Исторические данные о морской среде
|
Familiarize yourself with the use case scenario. |
Scenario
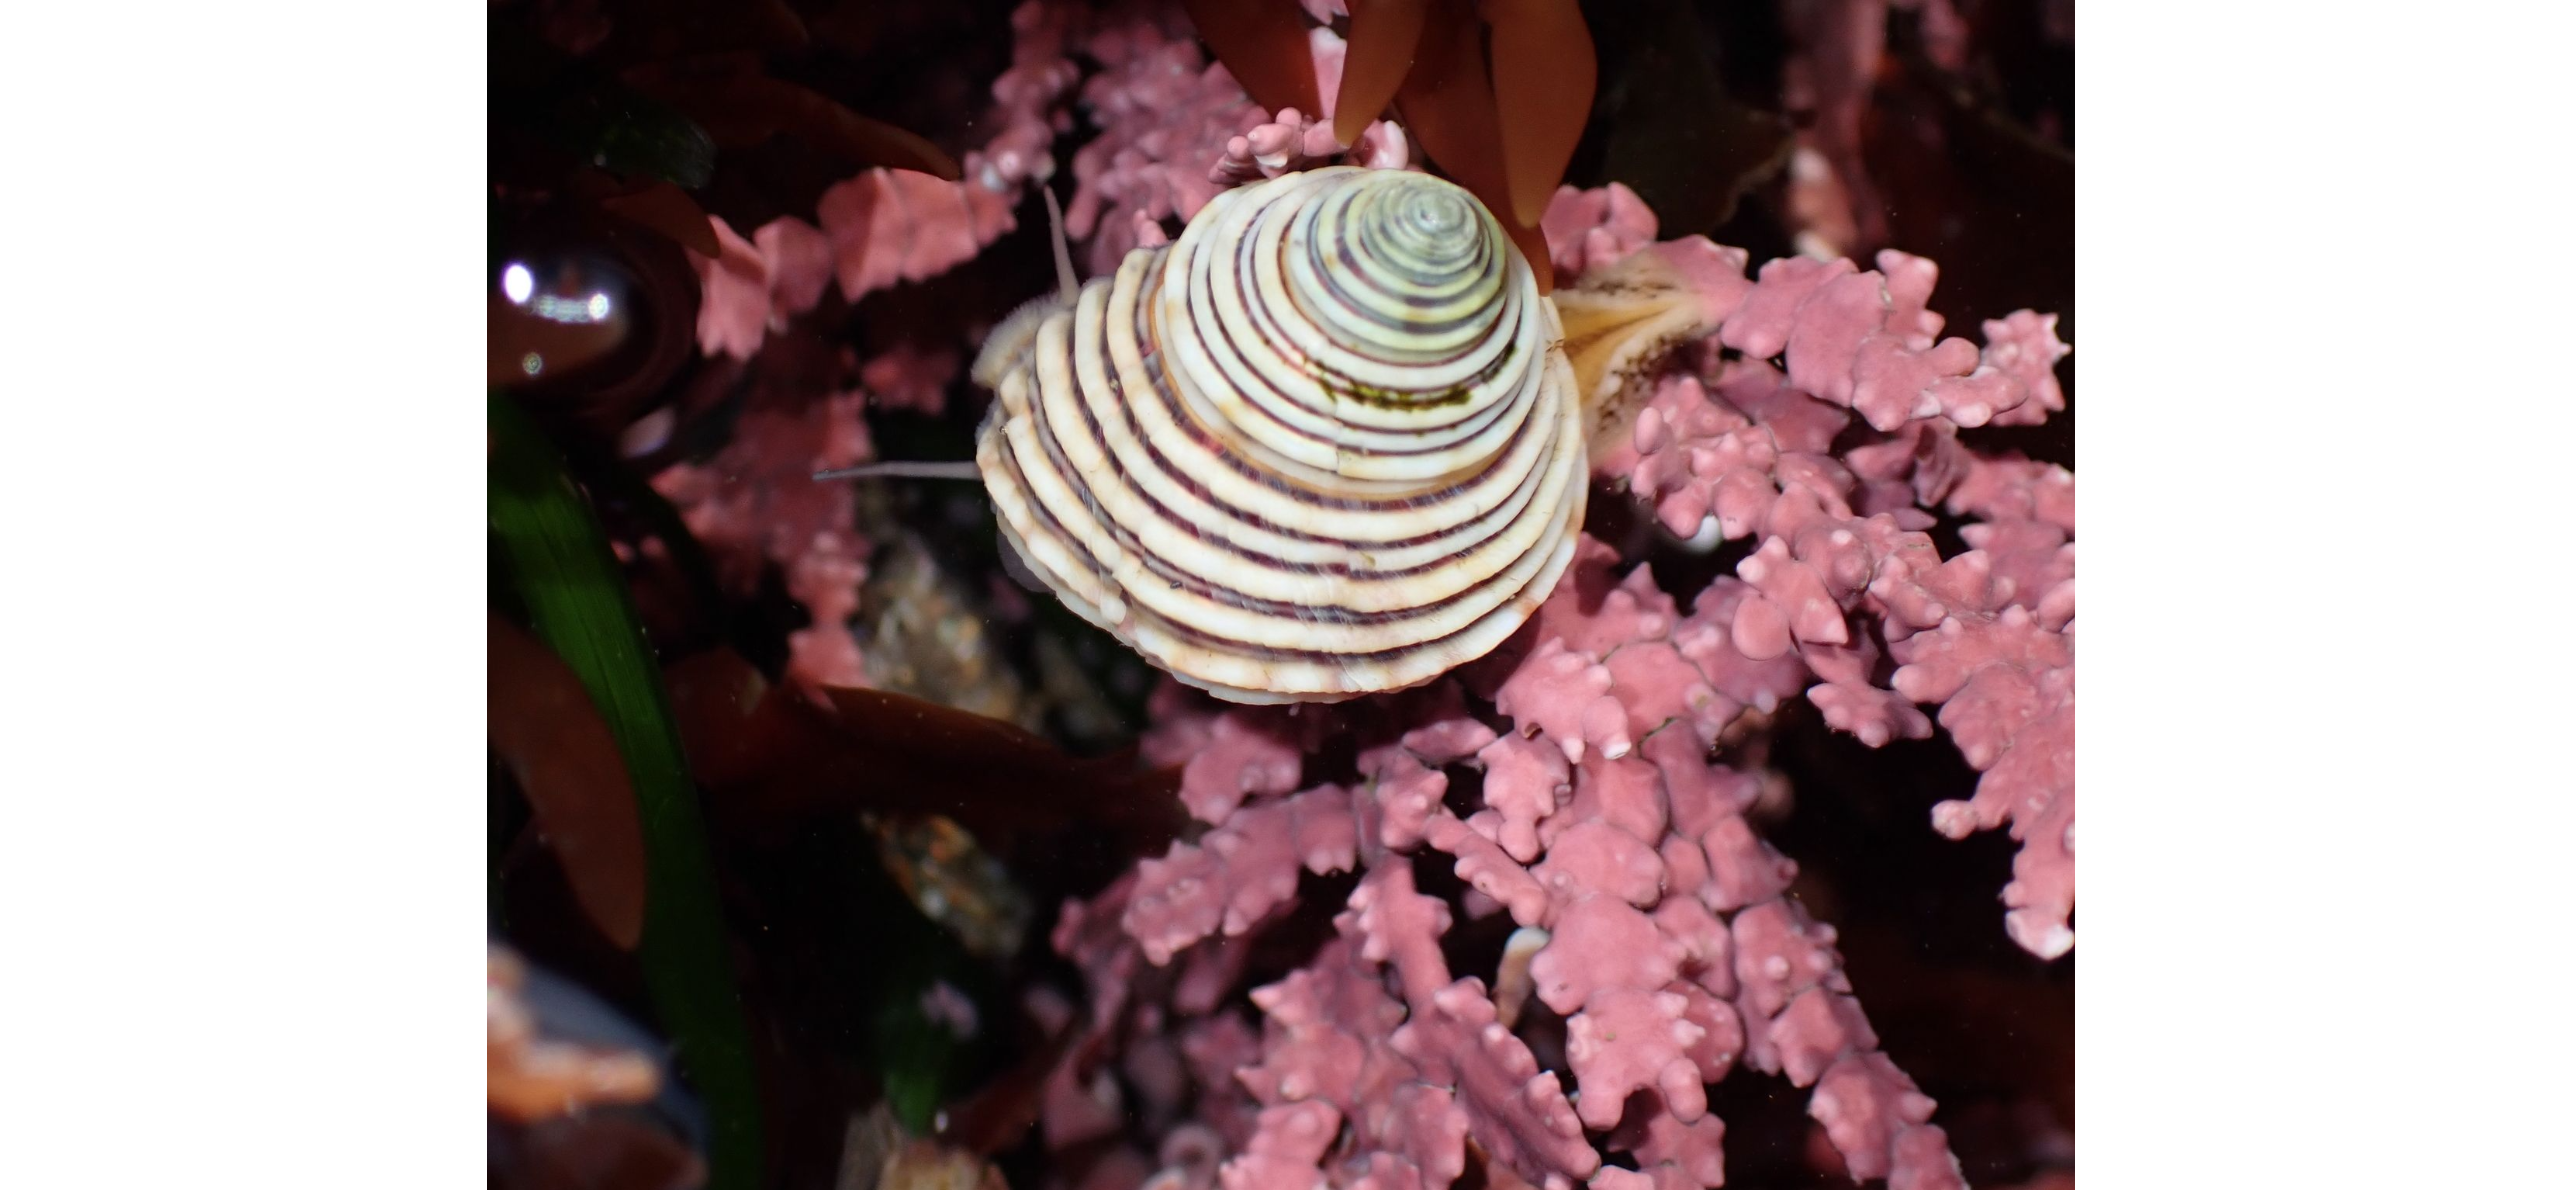
Данный учебный сценарий был разработан в качестве основы для практических занятий в рамках курса по мобилизации данных о биоразнообразии; концепция и содержание этих занятий были первоначально разработаны David Bloom и Amanda Whitmire для использования в курсе CESP2022-009 («Расширение сети: вовлечение морских исследовательских станций и библиотечных фондов в сообщество по обмену данными»).
Это вымышленный сценарий, основанный на реальном проекте и наборах данных. Он предназначен исключительно для учебных целей. Данные, используемые в этом практическом кейсе, не могут воспроизводиться в каких-либо иных целях без разрешения библиотеки Гарольда А. Миллера Морской станции Хопкинса (HMS-Library@lists.stanford.edu).
Описание
Морская станция Хопкинса (HMS) — это морская лаборатория Стэнфордского университета. морская исследовательская лаборатория Стэнфордского университета. Станция расположена на западном побережье Калифорнии, примерно в двух часах езды к югу от главного кампуса Стэнфордского университета. HMS является одной из старейших морских лабораторий США, а её библиотека располагает обширной коллекцией исторических данных о морских исследованиях, представленных в виде судовых документов, журналов, полевых дневников, научных работ (включая студенческие) и других аналоговых материалов.
While contributing to several large-scale digitization and online repository projects, the Head Librarian met a local GBIF Node Manager who encouraged HMS to begin the process of digitizing and publishing the library’s extensive collection of biodiversity data to GBIF and other data aggregators. Recently, the Librarian has made it a priority to begin the process to transfer the data from field books, note cards, and into a new collection of image files (.jpg), pdf documents and spreadsheets containing event and occurrence data. The new files, and the data contained within them, will be organized into the library’s new content management system.
The process of digitizing and publishing HMS data will take time. The library budget is allocated annually and does not include funds for digitization or to hire new staff for the project. Human resources are limited to the Head Librarian (who has a PhD in Oceanography), a Library Assistant with a MS in Library and Information Science, an undergraduate work-study student who is paid for 10 hours per week, and two local retirees who volunteer at the library twice weekly in four-hour blocks.
The Librarian and Assistant already possess a large-format scanner and the necessary software to scan the library’s wide variety of documents, including materials with bindings. Together, they have determined that digitization should begin with the work of one of HMS’ best known collectors, Willis G. Hewatt. They have also developed a preliminary workflow for the job:
-
Identify a specific locality or transect within the Hewatt archive and then identify any associated historic or modern faculty or student papers, journal articles, books, and associated resources (e.g., index cards, maps, field books).
-
The Library Assistant will pull all of the analogue resources from the HMS archives and then scan them into appropriate digital formats, using optical character recognition (OCR) whenever possible. Data formatted as tables will be converted and imported into a common spreadsheet.
-
The volunteers will review the OCR’d files for conversion errors and to confirm that the tables match the analogue source materials. Any living authors will be consulted when questions arise in regard to their work.
-
Under the supervision of the Library Assistant and Head Librarian (indirectly), the work-study student will map the data tables to Darwin Core fields adding information from associated papers and other written resources (e.g., journal articles, manuscripts). The Head Librarian will provide a final review to confirm the accuracy and completeness of the data.
-
All standardized tables will be sent to the GBIF Node Manager who will provide access to the Node IPT and who will register the Hopkins Marine Station with GBIF and ensure that the datasets are published correctly to both GBIF and the Ocean Biodiversity Information System (OBIS). Care must be taken to ensure data quality requirements are met for both GBIF and OBIS.
Original data collection
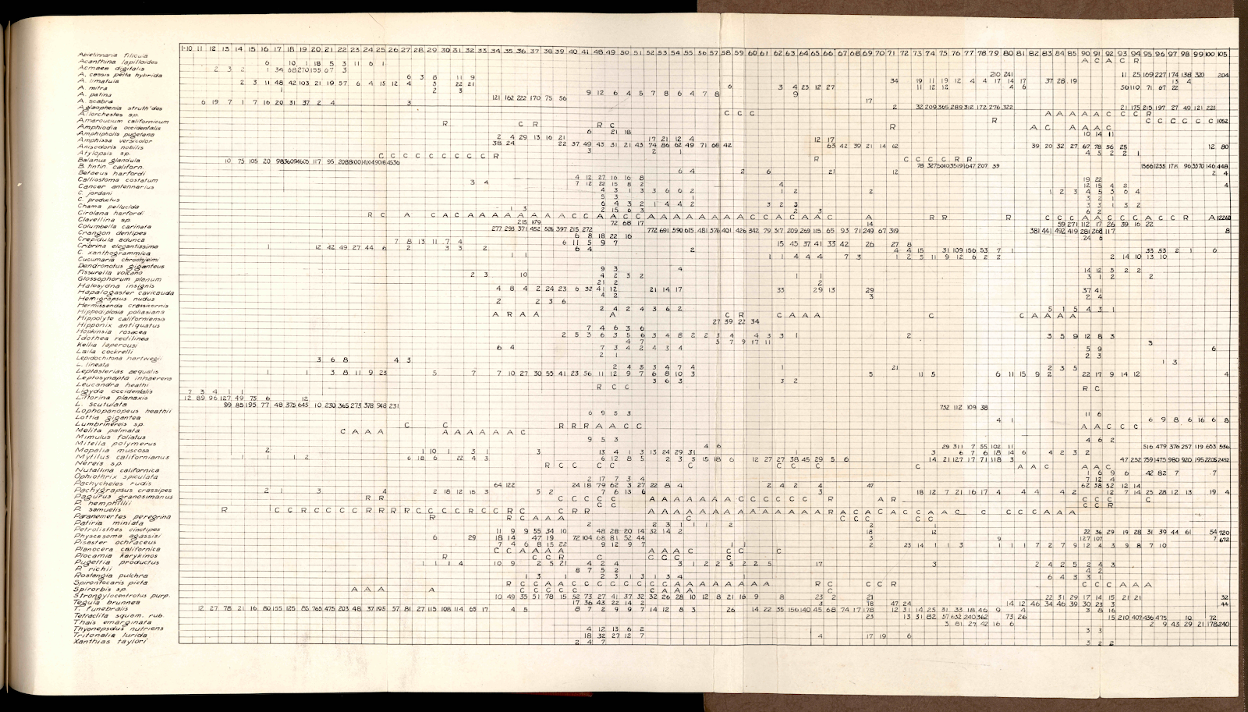
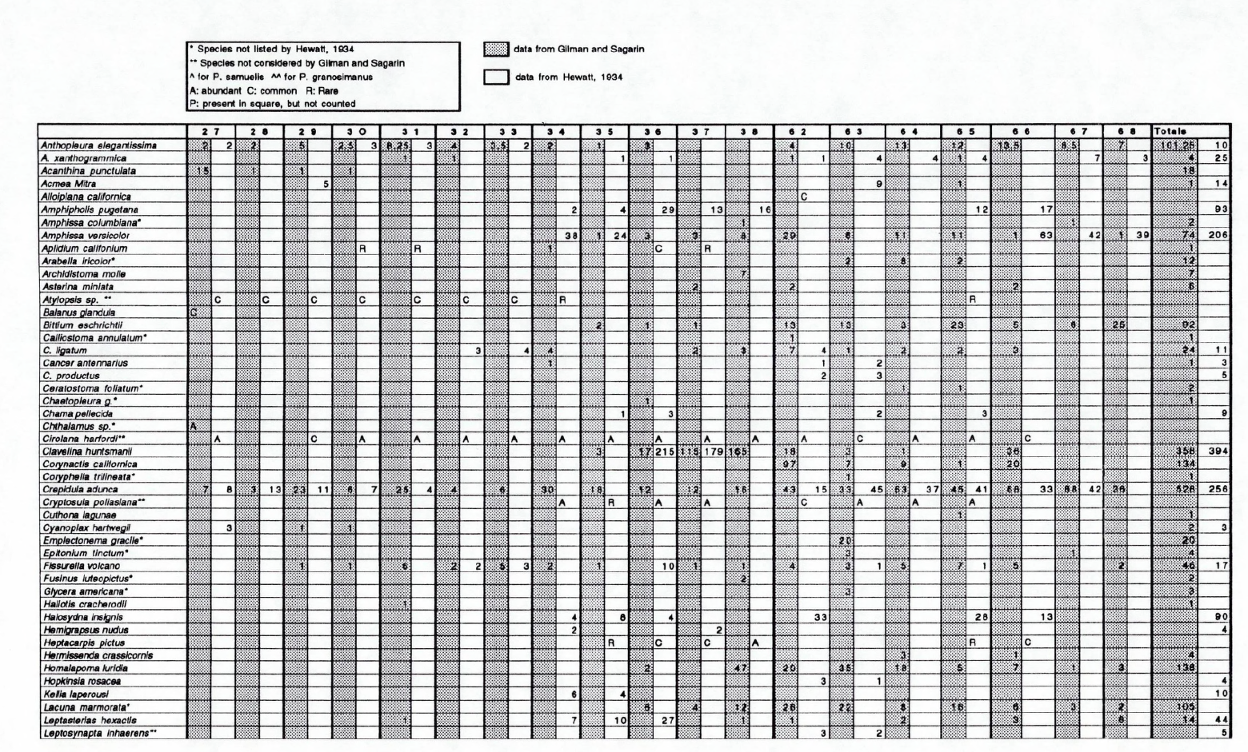
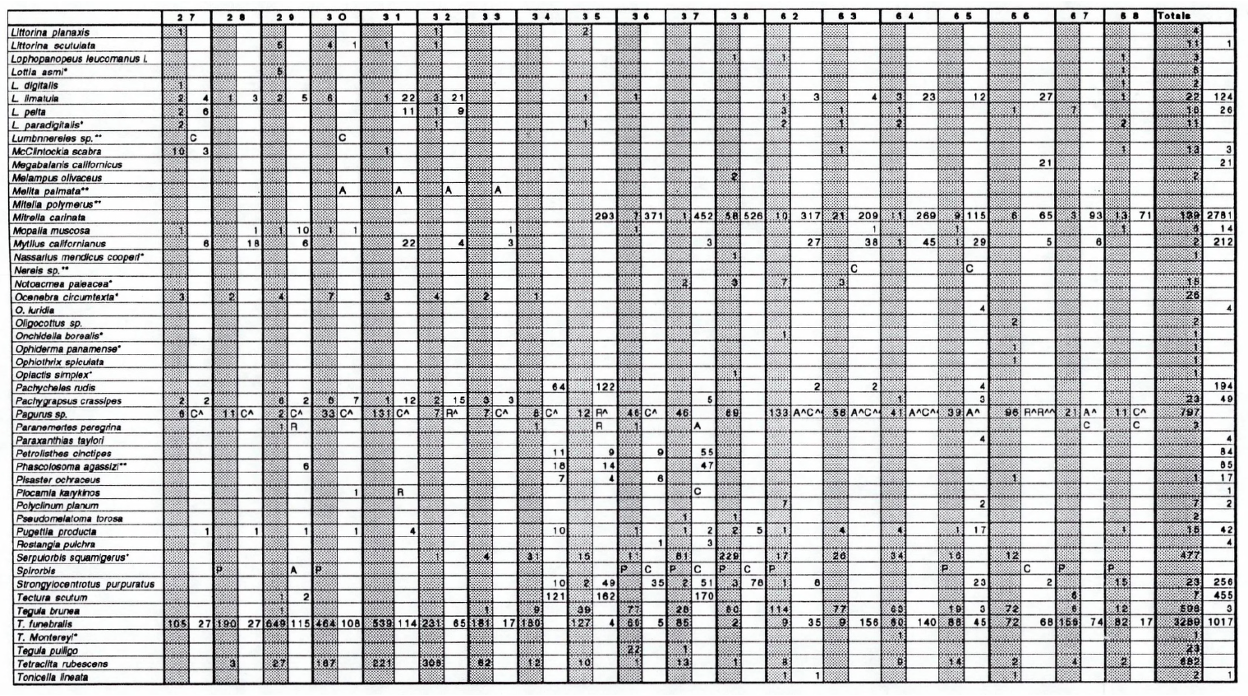
The first collection of data selected by the Head Librarian is the “Hewatt Transect”, a qualitative observational record of the intertidal zone directly adjacent to the HMS facility. Data along the 108 yard transect were sampled and reported in 1 square yard quadrats. While observations were recorded continuously from 1931 to 1933, with additional observations added in 1941, only a handful of selected ‘representative’ quadrats were sampled consistently (Figure 1). A student paper in 1993 (Gilman & Sagarin) sought to resurvey the same transect, although only part of the original transect was observed (Figures 2a and 2b). Both projects entered into the survey with a list of species expected to be present within the transect. Hewatt’s dissertation and Gilman & Sagarin’s student paper were preserved by the library, along with related published peer-reviewed papers. The data necessary to publish to GBIF, OBIS and other data aggregators is spread across all of the resources in the library archive.
Data conversion and aggregation
Both Hewatt and Gilman/Sagarin recorded data in a table format for species for each transect. These “lists” were converted into an initial spreadsheet format (Figures 3).
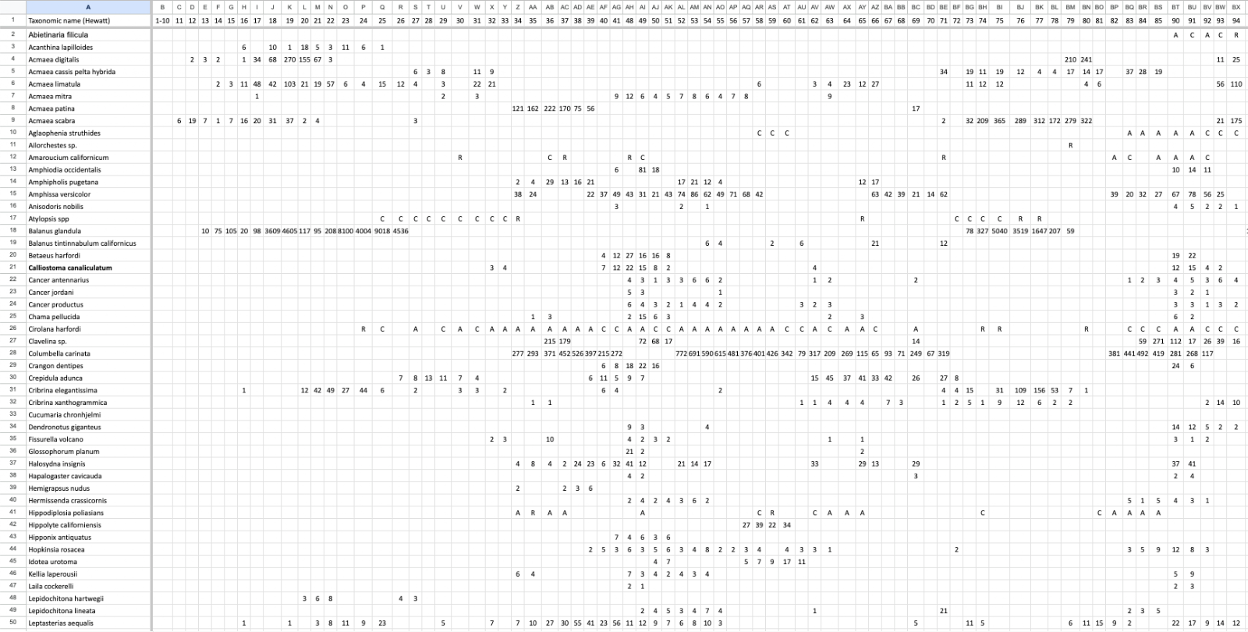
Data Assessment
As a part of the Head Librarian’s review the following data is available for 270 records collected by Willis G. Hewitt is available for sharing:
-
Дата
-
Глубина
-
Geographic coordinates
-
Locality descriptions
-
Research methods
-
Taxonomic information for individual species
-
Число видов
Ссылки
-
Hewatt, Willis Gilliland. “Ecological Studies on Selected Marine Intertidal Communities of Monterey Bay.” Ph.D., Stanford University, 1934. https://purl.stanford.edu/wr792fj0469.
-
Gilman, Sarah E., and Raphael D. Sagarin. “Temperature Correlated Long-Term Faunal Changes in the Rocky Intertidal.” Hopkins Marine Station Student Papers. Stanford (Calif.), 1993. Stanford Digital Repository. https://purl.stanford.edu/jd254tq7230.
Exercises
Download the exercise sheet. (MS Word, 2.8 MB)
Exercise 1
Data capture
-
You have been charged with creating a template to format the available data for sharing with GBIF and OBIS.
-
What data structure would you use to reflect the data?
-
What required fields should be included?
-
What additional data could be included or derived from the collected data?
-
What format will you use to uniquely identify records?
-
Create a spreadsheet using this structure.
-
Use the exercise sheet to provide your answers and submit the spreadsheet created in the previous step.
Exercise 2
Data management
-
You have been charged with cleaning the dataset. For the species records, you have been given a script that can be used in OpenRefine to assess the validity of species names against the World Register of Marine Species (WoRMS) using their API.
-
Download UC-MS-2-ForCleaning.xlsx. (36)
-
Download UC-MS-2-OpenRefineScript.txt. (7 KB)
-
Evaluate the dataset and identify which types of errors are present.
-
Identify possible ways to correct those issues, and perform those corrections.
-
Use the exercise sheet to provide your answers and submit the spreadsheet.
Exercise 3
Data publishing
-
Download UC-MS-3-ForPublication.xlsx. (51 KB)
-
Use the previously provided IPT installation to publish the given dataset.
-
Use the exercise sheet to provide your answers and link to the published dataset.